AIReport is a report application service for government and enterprise with Excel-like interface and drag-and-drop elements, designed to empower companies to generate reports and dashboards. Additionally, it helps to establish decision-making platform, gain insights into your business operations and greatly increased profitability.

For top-level managers
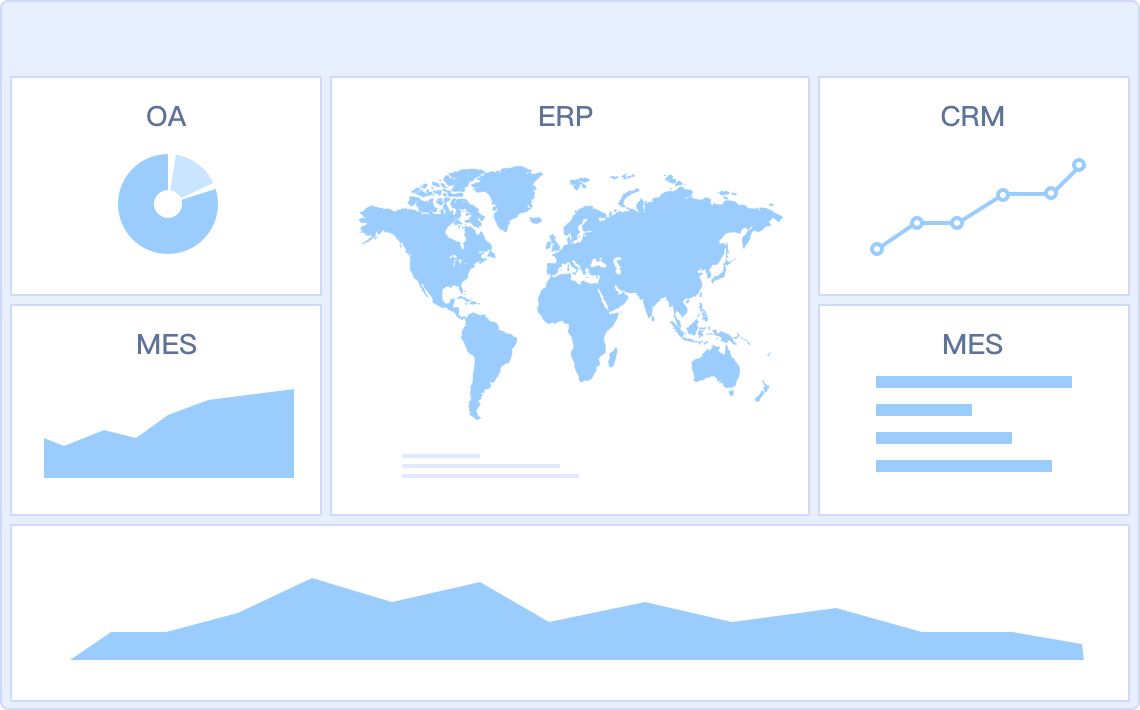
Data integration merges the scattered data into a single system, eliminating data silos and providing a comprehensive view of the organization.
TV dashboard and Mobile App allow you to keep track of critical business information and metrics anywhere and anytime, no matter in conferences or on business trips.
Decision-making platform gives you a very secure environment for quickly collecting, managing, and analyzing reports of various subsidiaries and departments.

For middle-level managers
Innovative design modes and reusable templates reduce the cost of creating reports.
Export to multiple formats simplifies sharing, presenting, and secondary analysis.
Automated reporting automates departmental reporting procedures to eliminate repetitive administration and human errors.

For operational-level employees
Smart data entry helps you to utilize forms to input or backfill information contained in reports to different databases conveniently.
Flexible data query supports you to track information from different dimensions.
Permission control ensures users at various levels have corresponding authorities to reports.

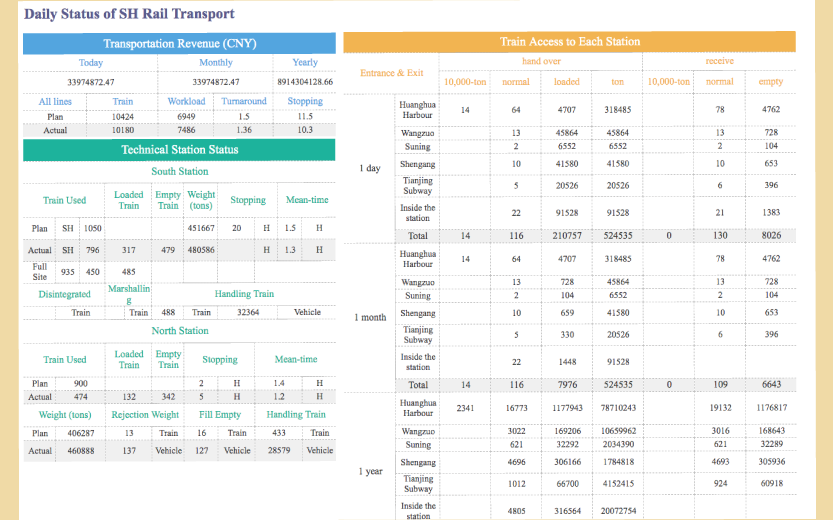
Easy to Make Complex Reports
Smart Data Entry
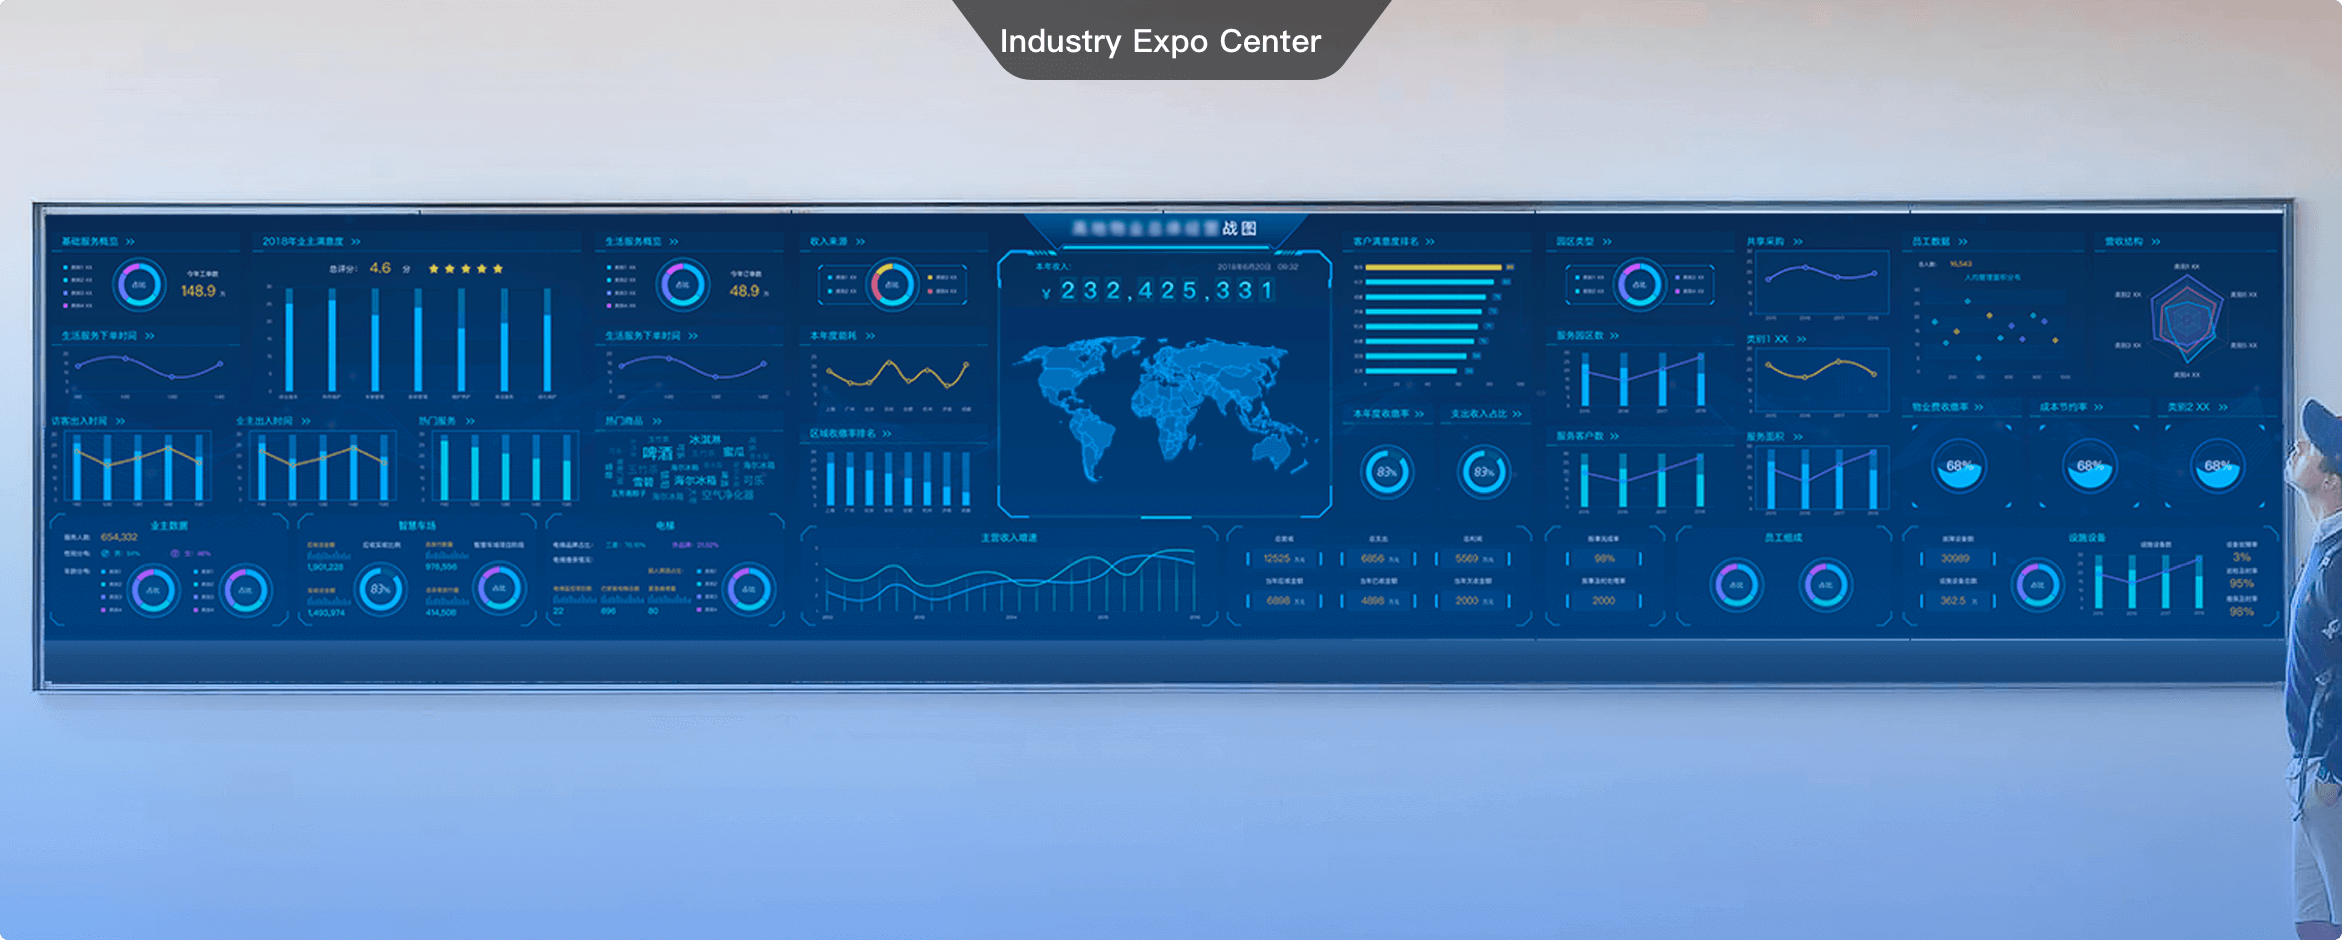
Large Screen & TV Dashboard
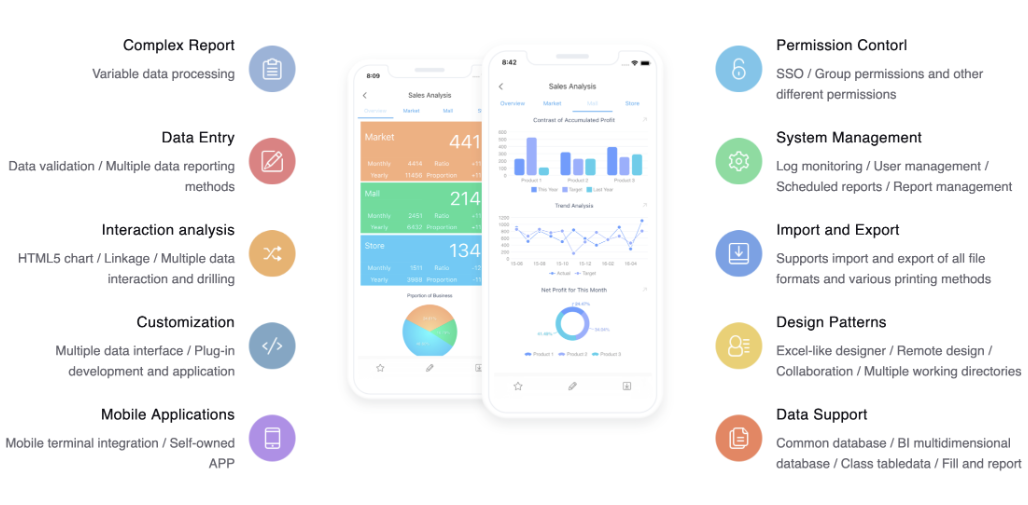
Convenient Mobile App

Powerful Decision-Making Platform
Flexible Deployment & Integration


Report Designer


Remote Design
The remote design allows you to modify the template connecting to a working directory on a remote server.
Template locked function avoids editing conflicts, and data authority control ensures the data safety when collaborating with your team.


Export, Print, and Share
Various export types, including PDF, WORD, EXCEL, TXT, SVG, and image format (PNG, JPG, BMP, etc.).
One-click to print complex bill and invoice in bulk.
Automated reporting helps you to schedule reports to generate and distribute them via email automatically.


Excel-like interface
An Excel-like interface with data-bound column dramatically reduces the cost of learning. Anyone who is used to Excel will be a fast learner of AIReport.
The drag-and-drop operation for non-technical users to quickly create a web report without additional learning or code base.
Product Architecture
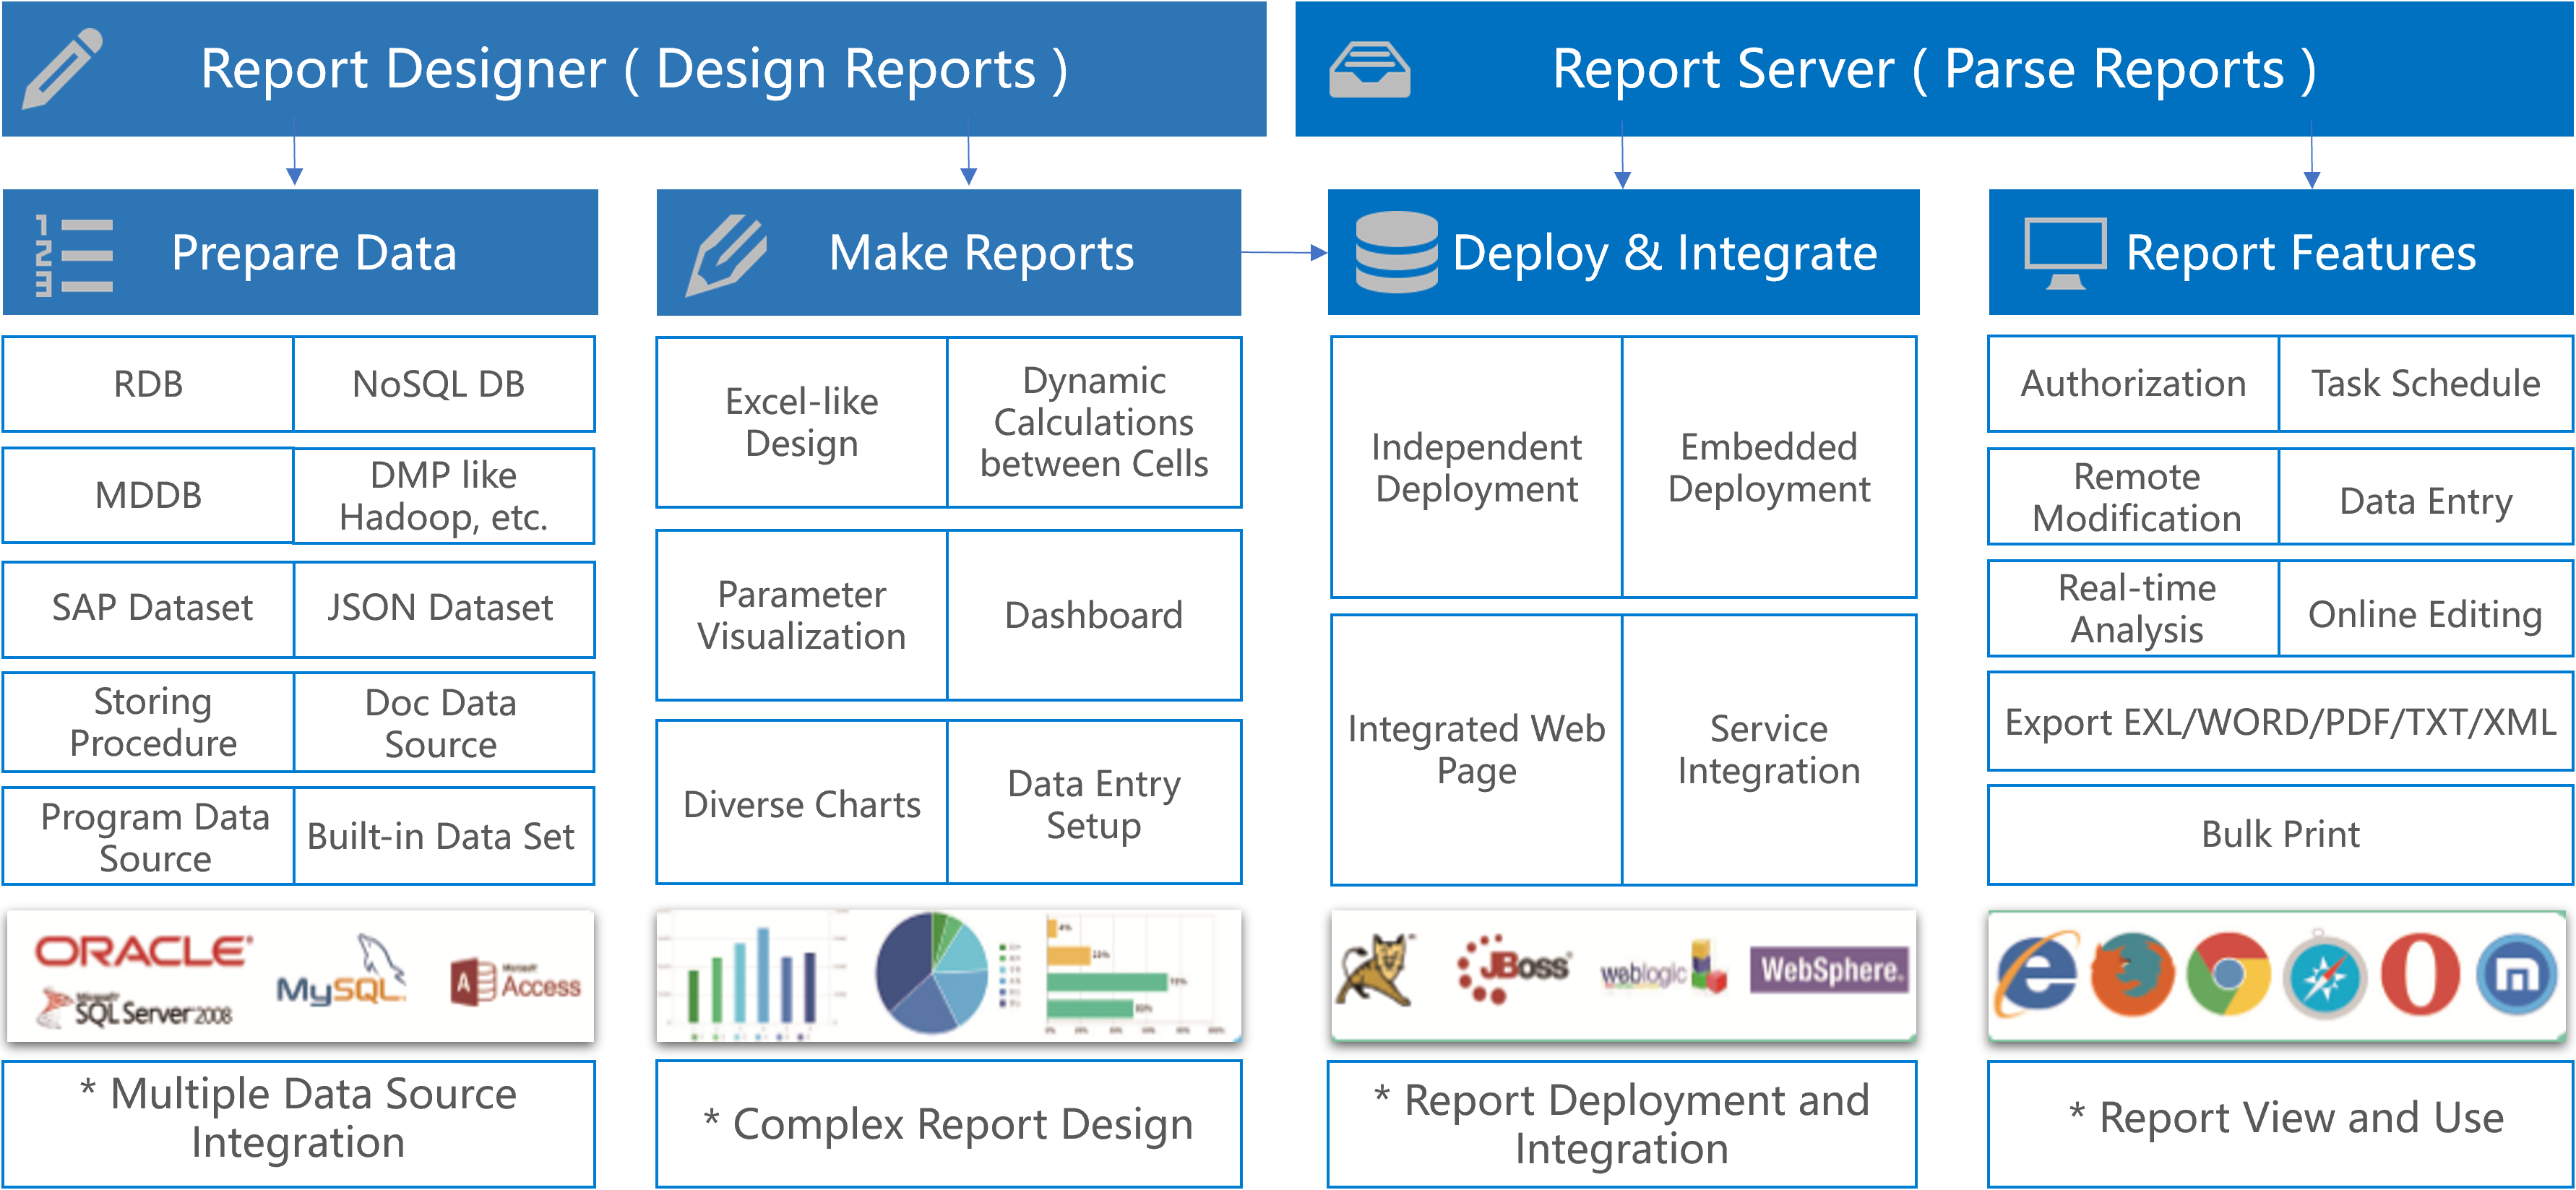


General Report: professional deal with complex reports
Easily set pagination, grouping, multi-columns.
Support building main-sub report, tree report and other customized reports.
The dynamic calculations between cells can conveniently realize the ranking, YoY, MoM, the proportion, the cumulative, and other operation cross row and group.
Aggregation Report: an innovative design for irregular reports
Free splicing together aggregation blocks, eliminating the trouble of frequently merging and splitting cells in Excel. Each aggregation block is independent. You can drag&drop and put them together freely to create irregular reports.
Dashboard: multi-perspective analysis for decision making
Support cloud share of dashboard templates and the reuse of components on-premise to improve efficiency.
Adapts to any screen size, from TVs and large screens to mobile devices.
Show live data and refresh automatically, support partial refresh and dynamically prompt for changed data.
Support chart linkage, data linkage, drill into details to perform advanced analysis.
Data Integration
Support extracting and combing data across databases and tables, and easy to integrate data from ERP/OA/MES and other enterprise systems in a single platform, which eliminates data silos within your organization.
Data Sources Support
Relational databases: include such mainstream relational databases as Oracle, SQLServer, MySQL, DB2, Sybase, Access, Derby, Postgres,Informix; Support SQL data sheets or views, or stored procedures.
Text data sources: Excel files, TXT files, XML files, etc.
Multidimensional databases: Essbase, ssas, sap, hadoop, FineCube
Nosql data source: MongoDB
Buit-in datasets: Server built-in datasets and report built-in datasets
Others: Program data source, JSON, SAP data source
Data Entry

Various widget types support data entry of massive data volume
Intelligent data submission control satisfy customized submission requirements
Comprehensive data validation ensure the correctness of the data formats
Support import excel data online and in batches

Offline data entry get you rid of the network constraint
Smart temporary storage avoids data loss due to accidents
The multi-sheet data entry combines multiple independent reports in a tab way for easy editing of various reports at the same time
Multi-level reporting can quickly achieve the process of data reporting, approval and return
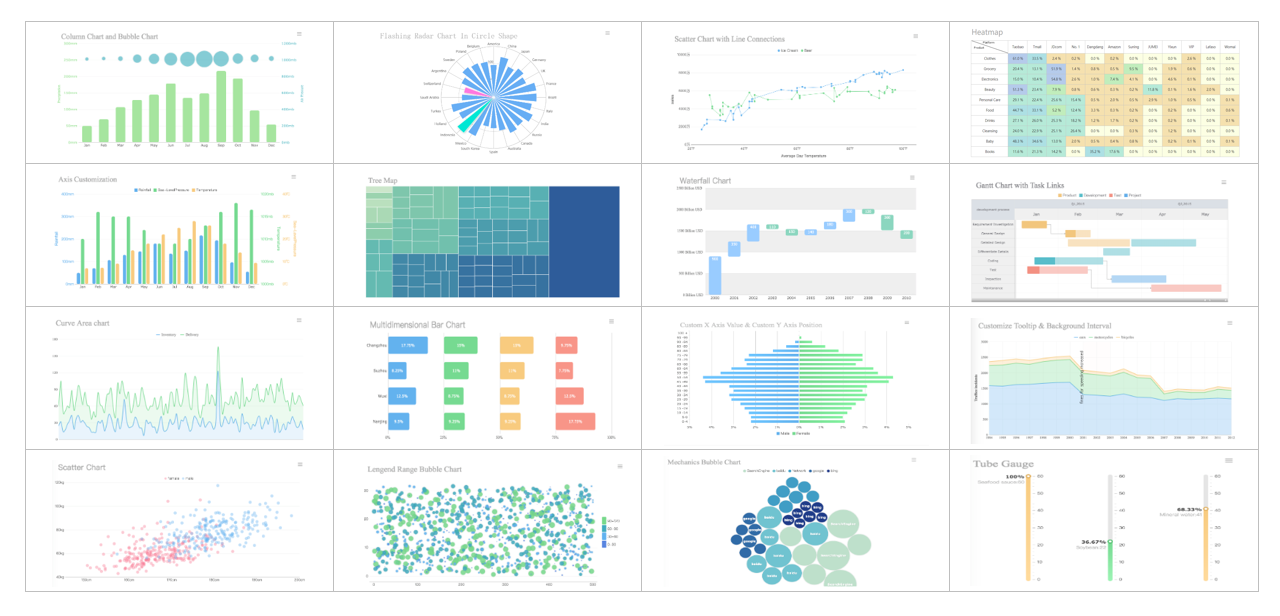
Data Visualization Chart
Impressive HTML5 charts provided by AIReport can be used cross-platform, adaptive to web design, and support instant update. You can also connect to Echarts and other thirdparty controls to make charts, or use novel diagrams developed based on WebGL.
Dynamic Interactive Effects
3D effects
Data Map
Data Tips
Interactive Highlighting
Series Interaction
Online Switch
Coordinate Scaling
Automatic Refresh
3D Cylindrical Earth
3D Point Earth
3D Flow to Earth
KPI Indicator Card
Time Gear
Catalog Gear
Symbol Map
Regional & Drill Map
Heat Map
Flow Map
Custom Map
GIS Map


TV/Large Screen Dashboard
Canvas-like interface with various layout modes
Easily integrate data from multi-business systems such as ERP/OA/MES for multi-perspective
Special chart plug-ins for TV and large screens
Show live data and refresh automatically, with problem alert


Mobile APP
Newly adopted ReactNative technology, gives you perfect product experience as PC, helps you manage and analyze data at fingertips.
Component Magnification

Chart Zooming

Data Point Prompt

Table Flipping Over

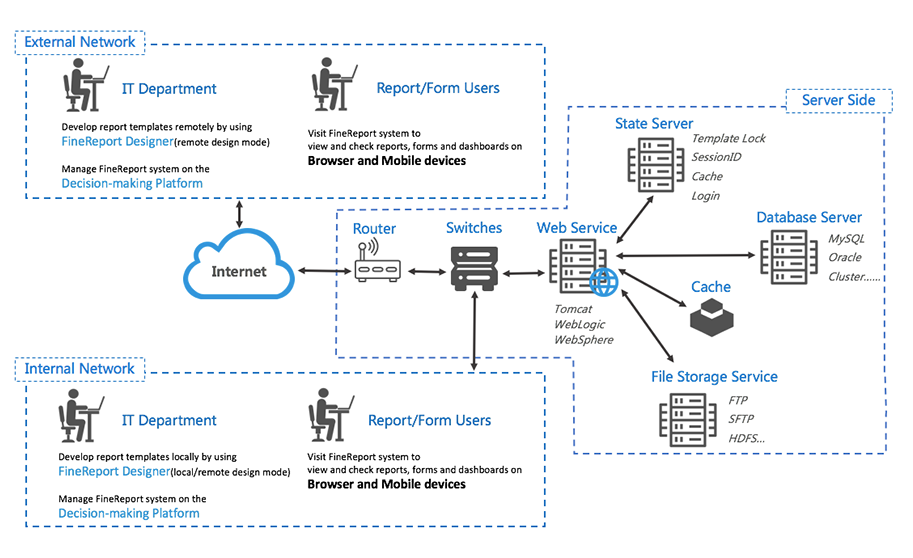
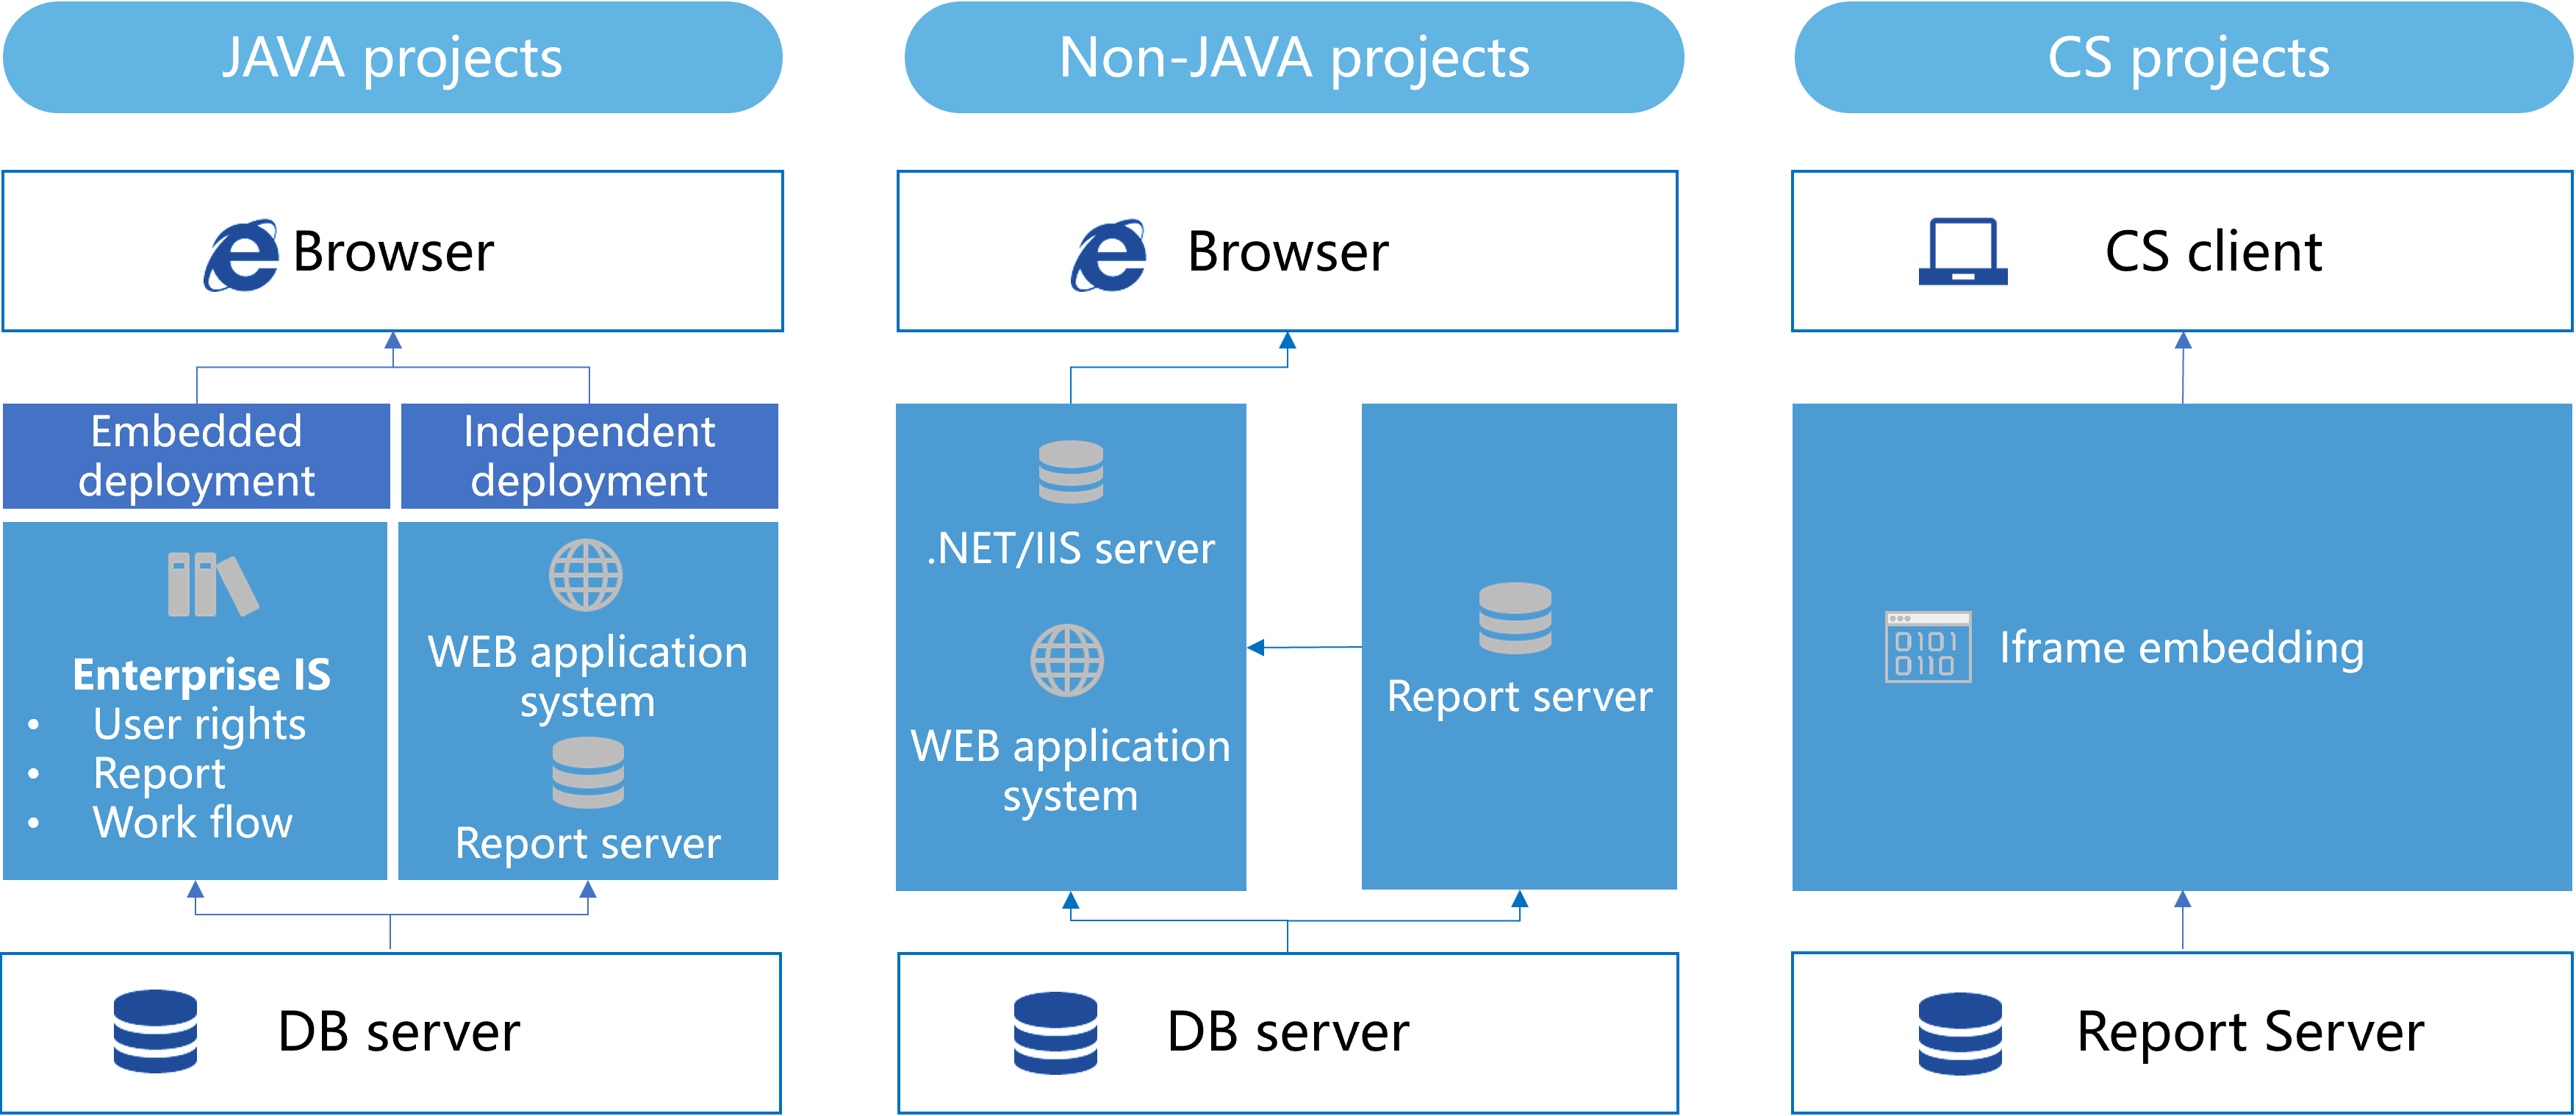
Deployment & Integration
100% Java software, supporting Windows, MacOS, and Linux. Easily integrate with existing OA, MES, ERP, etc.
Can be seamlessly integrated with any JAVA projects, supports independent and embedded deployment
Non-JAVA projects can calso be perfectly deployed and integrated with the support of an independent web server
C/S system and page integration are achieved through embedded browser controls and iframe
Cluster with high consistency and high availability
Four approaches for single sign-on to support multiple systems: ajax, iframe, action, CAS


×